Chapter 4 – North American Post-Glacial Flooding
Book Extract……………………………..
The geological formations of valleys are created by running rivers and shifting glaciers. Valleys are depressed areas of land–scoured and washed out by the conspiring forces of gravity, water, and ice. Some hang; others are hollow. They all take the form of a “U” or “V” formation.
Rivers and streams make most primary valley cuts, carving steep-walled sides and a narrow floor that from a far looks like the letter “V.” The gradient of the river from its highest-level increases flow rate, and helps define the steepness of the sides and the width of the floor. Mountain valleys, for example, tend to have near-vertical walls and a narrow channel, but out on the plains, the slopes are shallow, and the channel is wide.
As waters wind toward the sea, they add to natural twists in the land by stripping sediment from the outsides of bends and dumping it on the insides. The bulk of the rock and dirt is dredged from the bottom of the channel, a process called down cutting that can ultimately lead to deep, slender chasms like Black Canyon in Colorado’s Gunnison National Park.
But not all rivers are the product of geologically accepted valley formations.
Over the last glacial cycle, ice sheets and the resultant glacial isostatic adjustment (GIA) rearranged river systems, according to Andrew Wickert in his paper’ Reconstruction of North American drainage basins and river discharge since the Last Glacial Maximum’. As these riverine threads that tied the ice sheets to the sea were stretched, severed, and restructured, they also shrank and swelled with the pulse of meltwater inputs and time-varying drainage basin areas, and sometimes delivered enough meltwater to the oceans.
At the time of the LGM ice extent, ca. 30k to 19.5k BP. North American drainage configurations and river discharge were dramatically different from those at present. But until now, surface water flow paths have not been used to evaluate the suite of proposed past ice sheets critically.
In general, there exists a lack of recognition of the importance of Pleistocene drainage rearrangement on river systems. Despite the broad knowledge that river systems and drainage basins have changed significantly since the LGM.
Wickert, in his paper, showed in the meltwater discharge that the nine existing rivers in Northern America massively increase their flow to discharge the ice melt into the surrounding seas in comparison to today’s outputs.
Table 4 – North American Discharge rate (from Figure 15).
| River | Peak flow Date (B.P.) | Peak Discharge( M3S-1) | Today’s discharge (M3S-1) | Increase factor % |
| Mississippi | 15,000 | 160,000 | 16,790 | 852.95 |
| Susquehanna/Chesapeake | 15,000 | 30,000 | 1,135 | 2,543.17 |
| Hudson River | 10,000 | 120,000 | 606 | 19,701.98 |
| St Lawrence River | 9,000 | 140,000 | 16,800 | 733.33 |
| Hudson Strait | 9,000 | 200,000 | 40,000 | 400.00 |
| Mackenzie River | 12,000 | 80,000 | 9,910 | 707.27 |
| Columbia River | 15,000 | 160,000 | 7,500 | 2,033.33 |
| Colorado River | 12,000 | 80,000 | 500 | 15,900.00 |
| Rio Grande | 20,000 | 1,000 | 68 | 1,370.59 |
| Average | 107,888 | 10,368 | 940.59 |
This evidence shows that River volumes and therefore levels were higher in the past than today as an average around 941% of extra water was washed down existing ‘terrestrial rivers’ towards the end of the last ice age. Wickerts river model also included information on the duration of these ice pulses, which showed that they lasted well into the European Mesolithic period.
“After 8.2 ka, Hudson Bay continued to receive a smaller meltwater input from the ablating remnant Laurentide ice caps (Carlson et al., 2008) that included one last ∼ 200-year period of enhanced discharge ∼ 7.55–7.35 ka that appears in the δ18O record. (Jennings et al.,2015)”.
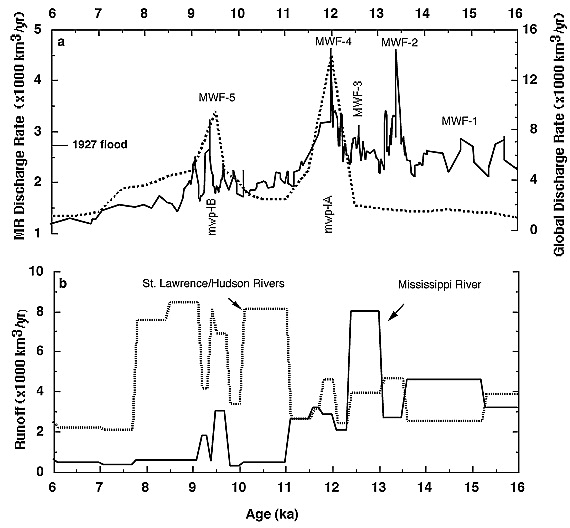
Total discharge (Figure 15) from each North American river basin, represented on a single set of axes to compare the timing and absolute magnitudes of meltwater discharge among the models, with the geologic record of enhanced past discharge (grey shading: dark, direct record; light, inferred and/or less-enhanced discharge).
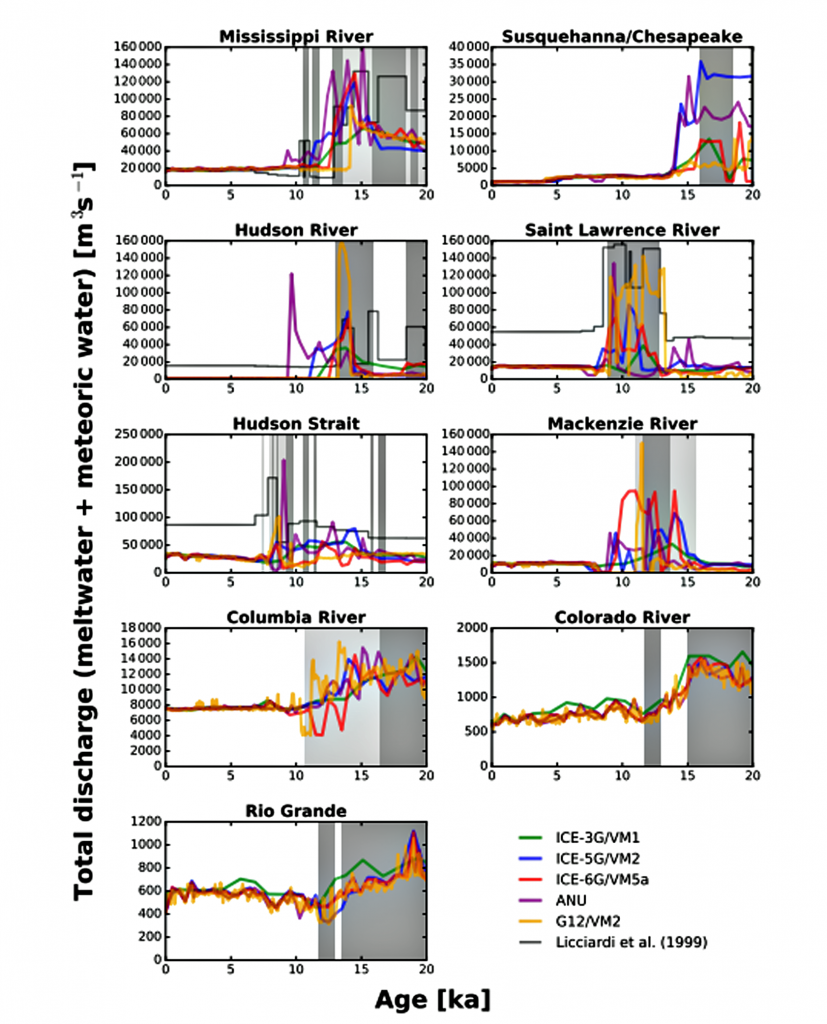
| Figure 15. – Total discharge from each North American river basin |
Also shown here in darker grey lines on four panels are the data-driven discharge histories of Licciardi et al. (1999), with their original radiocarbon chronologies calibrated using IntCal13 (Reimer et al., 2013).
In fact, all the American rivers show that extra ‘meltwater’ would have enhanced the size of these post-glacial rivers well into the European Neolithic period.
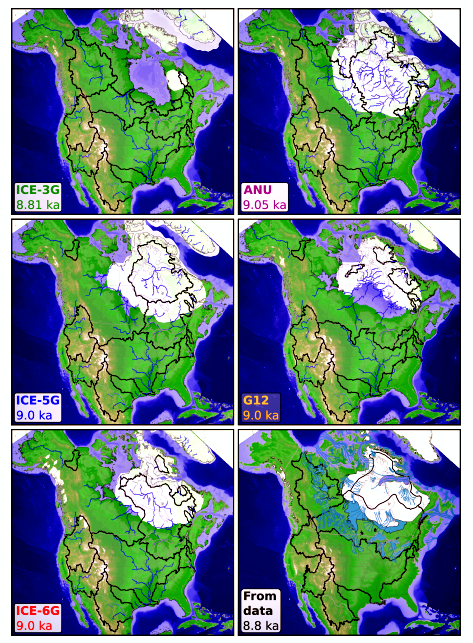
| Figure 16.- Expanded North American Holocene River discharge network |
Case Study – Mississippi River
The Mississippi River is the second-longest river and chief river of the second-largest drainage system on the North American continent, second only to the Hudson Bay drainage system. From its traditional source of Lake Itasca in northern Minnesota, it generally flows south for 2,320 miles (3,730 km). In a volume of discharge, the Mississippi’s rate of roughly 600,000 cubic feet (17,000 cubic metres) per second is the largest in North America and the eighth greatest in the world – The average annual discharge on the Upper Mississippi River increases from 9,180 cubic feet per second (cfs) near St. Paul, Minnesota to 204,800 cfs at Thebes, Illinois
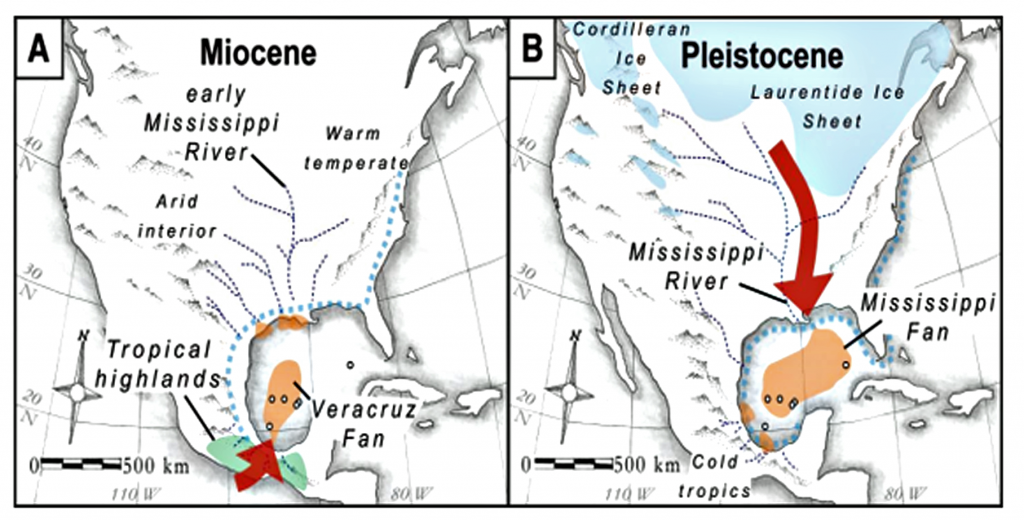
The current form of the Mississippi River basin was largely shaped by the Laurentide Ice Sheet of the most recent Ice Age. When the ice sheet began to recede, hundreds of feet of rich sediment were deposited, creating the flat and fertile landscape of the Mississippi Valley. During the melt, giant glacial rivers found drainage paths into the Mississippi watershed, creating such features as the Minnesota River, James River, and Milk River valleys. When the ice sheet completely retreated, many of these “temporary” rivers found paths to Hudson Bay or the Arctic Ocean, leaving the Mississippi Basin with many features “over-sized” for the existing rivers to have carved in the same time period.
| Figure 17. – Mississippi River Discharge |
The upper Mississippi valley is a 250-m-deep trench incised through the bedrock of the low-relief Paleozoic Plateau of the north-central United States, in the middle of the stable North American craton. Recent work traces its origin to advancing continental ice sheets, which dammed northeast-flowing rivers into lakes that then overtopped bedrock drainage divides and incised to form the modern integrated Mississippi. Today, the bedrock valley floor of the upper Mississippi River is buried beneath up to 110m of alluvium, hiding its shape and therefore the topographic evidence of the events that formed it.
New oxygen and carbon isotope records from the northern Gulf of Mexico dip in exceptional detail the succession of meltwater floods that occurred 16 to 8.9ka (14C years B.P., ka, kilo annum) (Aharon, 2003),
This evidence shows that existing rivers not covered by the ice sheets of the last ice age are the normal conduits for glacial meltwater not only at the end of the ice age when the glacier melts but also during the later periods of the last ice age as the groundwater and water tables rise in line with the seepage (infiltration) we have previously calculated. Moreover, this massive water drainage completely altered their original channel and surroundings.
| Figure 18 – Increased discharge rate in North American Holocene period. |
For more information about British Prehistory and other articles/books, go to our BLOG WEBSITE for daily updates or our VIDEO CHANNEL for interactive media and documentaries. The TRILOGY of books that ‘changed history’ can be found with chapter extracts at DAWN OF THE LOST CIVILISATION, THE STONEHENGE ENIGMA and THE POST-GLACIAL FLOODING HYPOTHESIS. Other associated books are also available such as 13 THINGS THAT DON’T MAKE SENSE IN HISTORY and other ‘short’ budget priced books can be found on our AUTHOR SITE. For active discussion on the findings of the TRILOGY and recent LiDAR investigations that is published on our WEBSITE you can join our FACEBOOK GROUP.