Chapter 1 – The Last Ice Age
Introduction
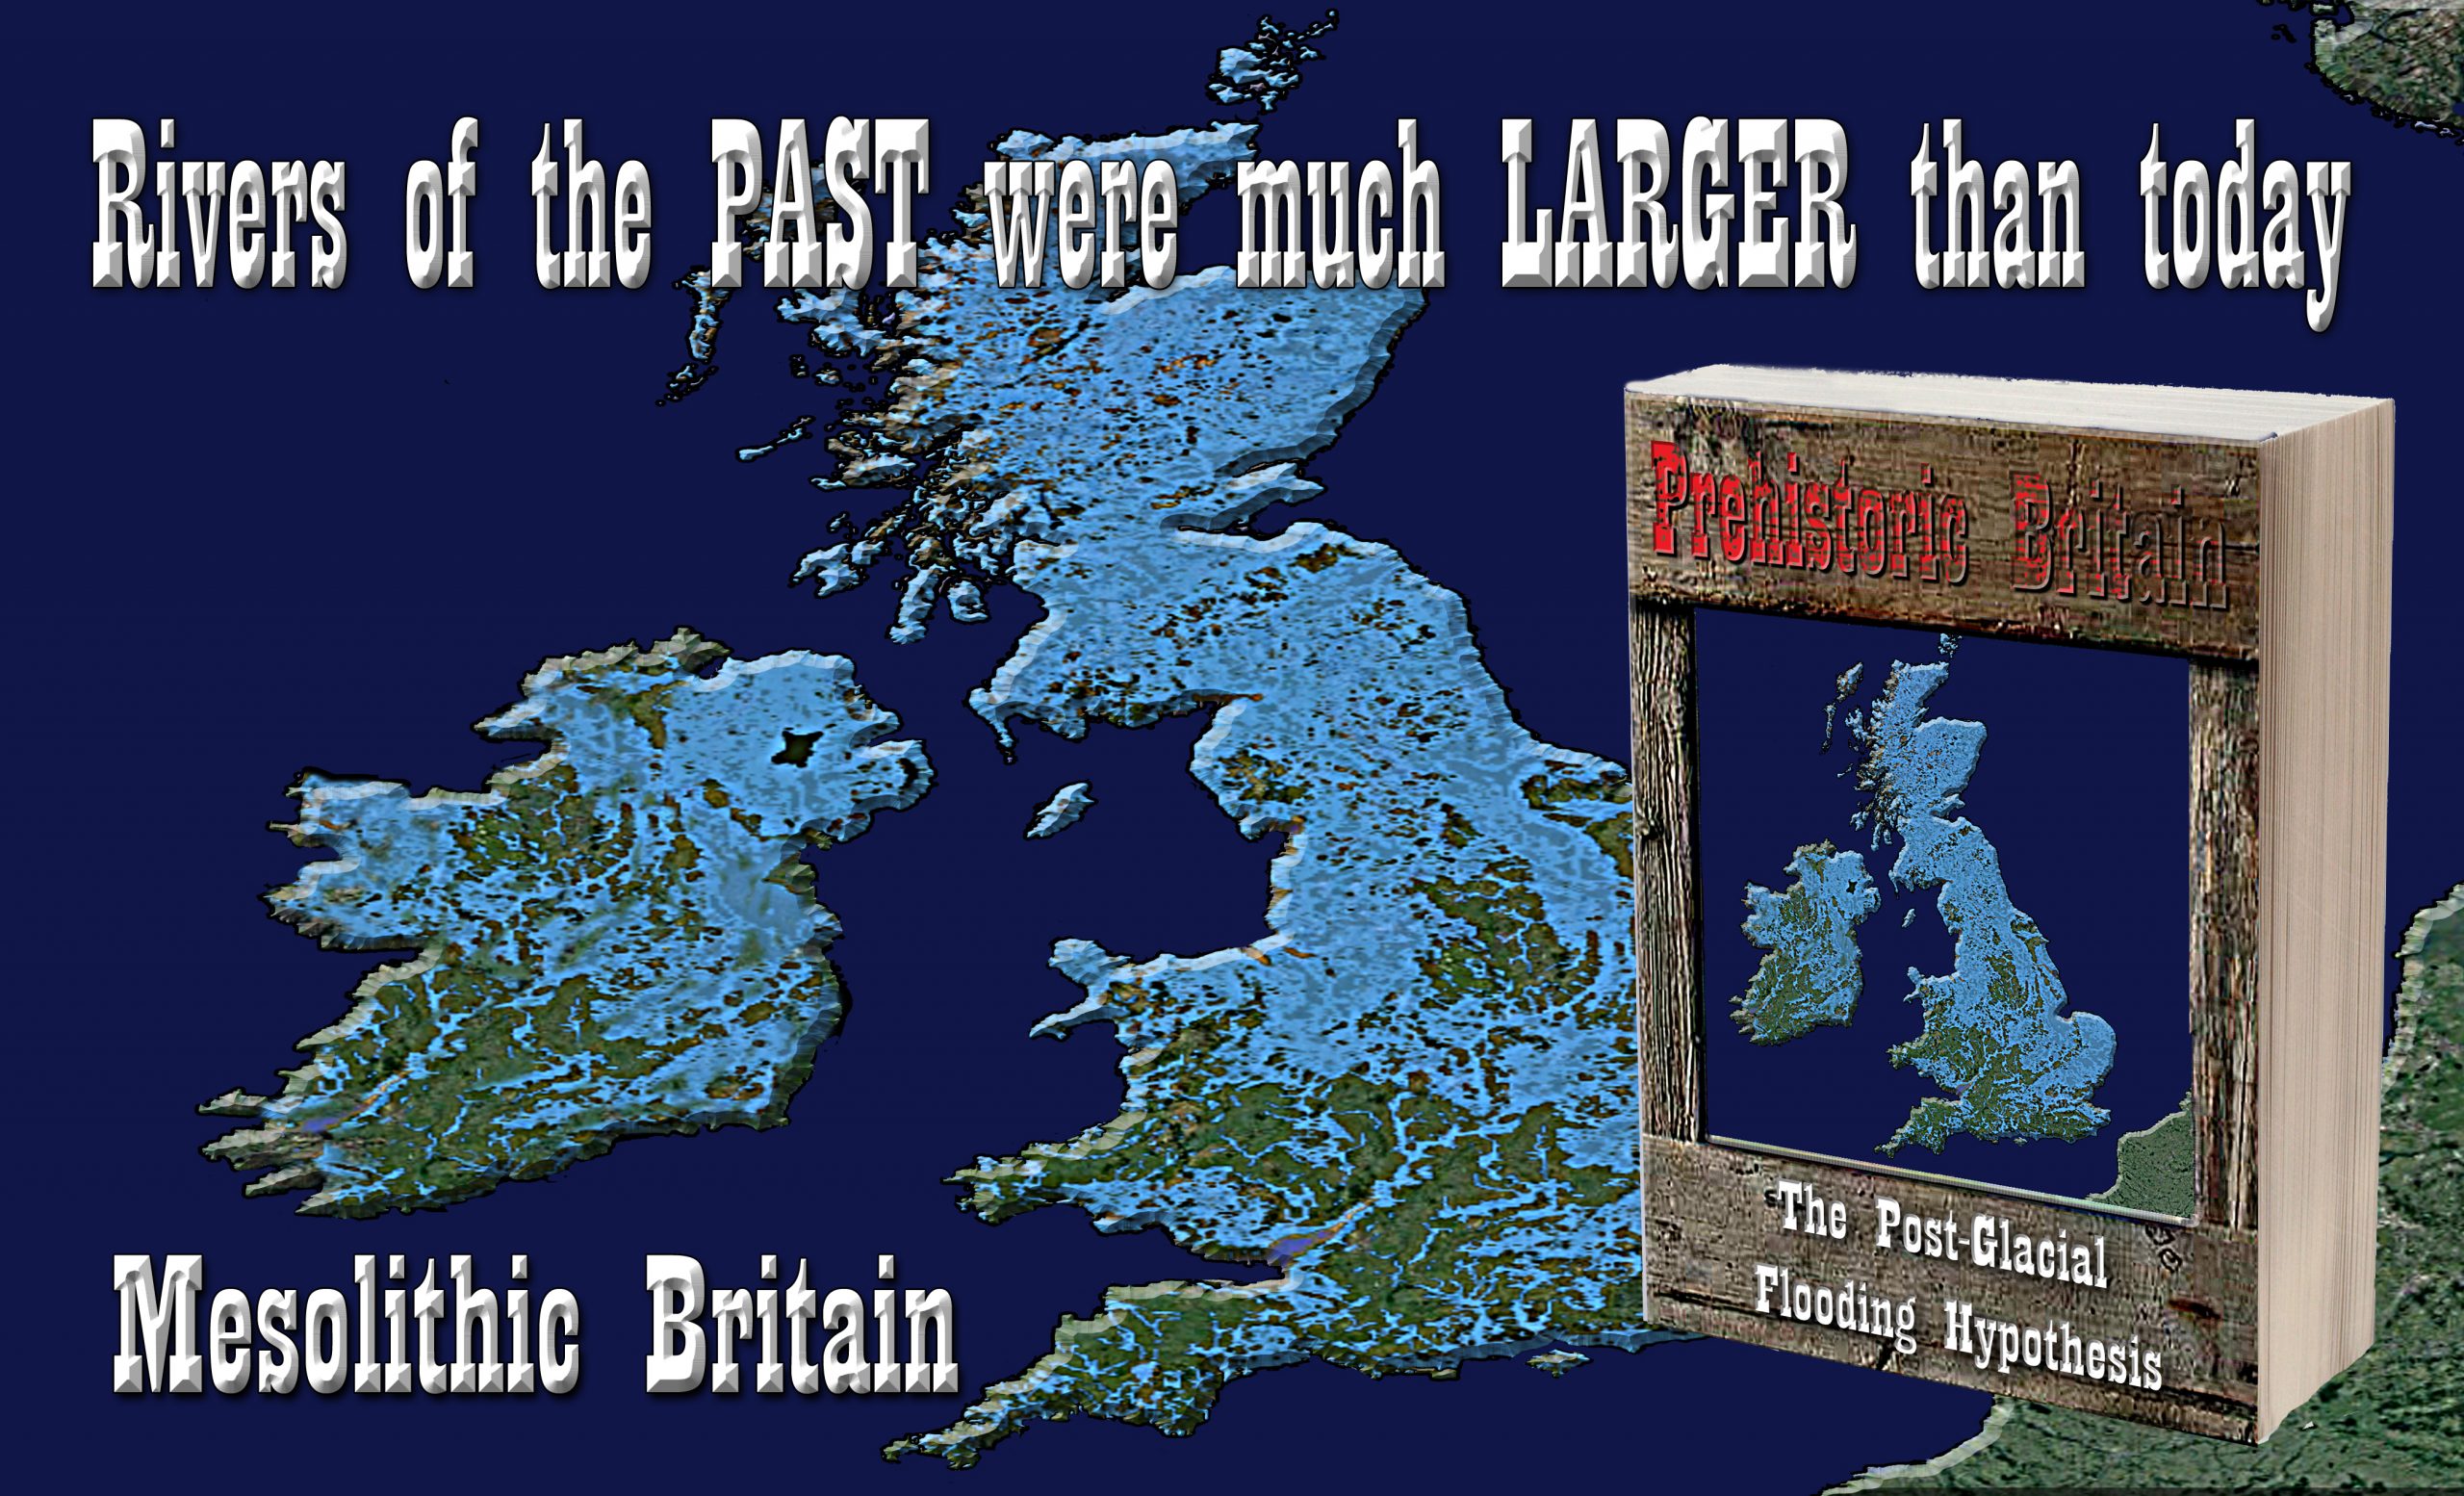
Twelve thousand years ago, according to our written history, the glaciers from the last Ice Age finally melted away, revealing the Britain we know today. For over 100,000 years (at the end of the Pleistocene Epoch) Britain had been underneath two miles of ice, compressing the ground by its sheer weight, so much so, that the land surface was then some 2,000 feet below its original level. Which has consequently risen back slowly, to become the landscape we know and are familiar with nowadays.
Geologists have assumed that these glaciers melted due to warming in climatic conditions creating a series of ‘meltwater pulses’ over a short period of time, but they have failed to date to produce a realistic model that fits the total meltwater discharge which eventually created not only the North and Irish Seas but the hundreds of feet of sea-level rises that we are still experiencing today.
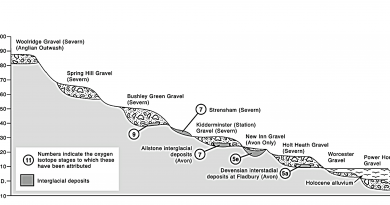
If you study any British Geological Society (BGS) map of Britain, you will notice it shows a series of bedrock, sedimentary and superficial deposits. Below these deposits, is a labyrinth of material that look like canals and gigantic waterways which lay under the surface on top of the bedrock, which is the remains of Palaeochannels from the last ice age. This evidence is a testament to how the landscape would have looked when the rivers were at their highest and when they were discharging at their maximum levels.
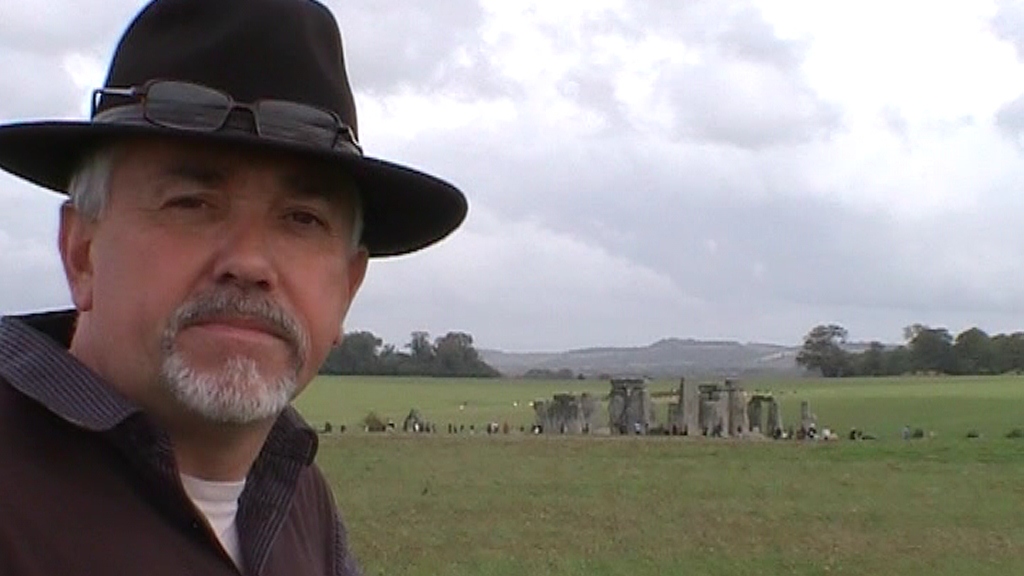
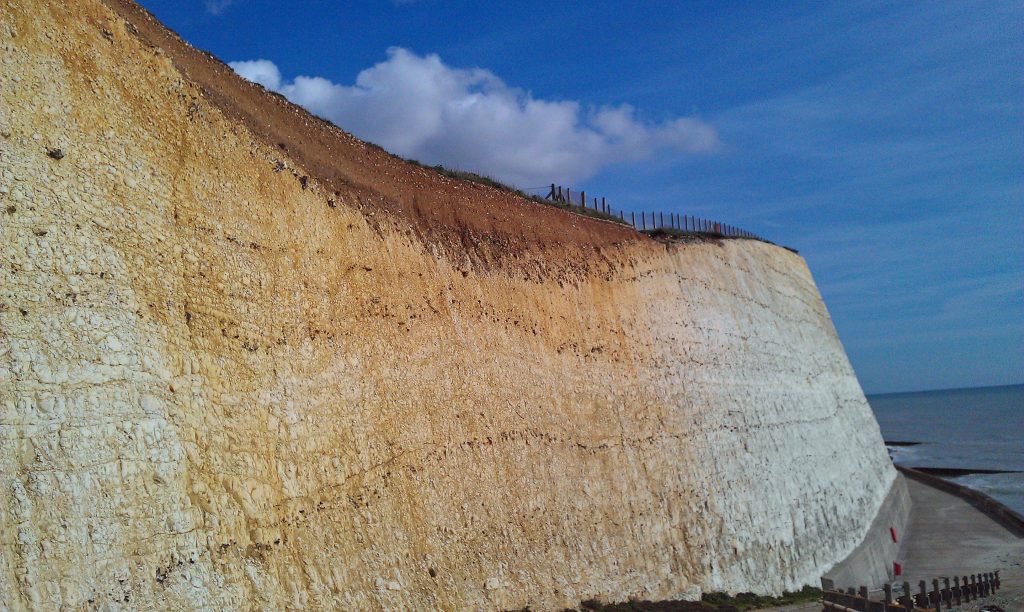
These superficial deposits that resemble ancient rivers can be seen on the surface and are known to archaeologists, geologists and the general public as ‘Dry River Valleys’ – because the river valleys today are currently dry. These great waterways can be readily seen in profile in the cliffs and valleys of the South Downs, where they show their curved river nature by the remains of the superficial subsoil consisting of sand, silt and clay.
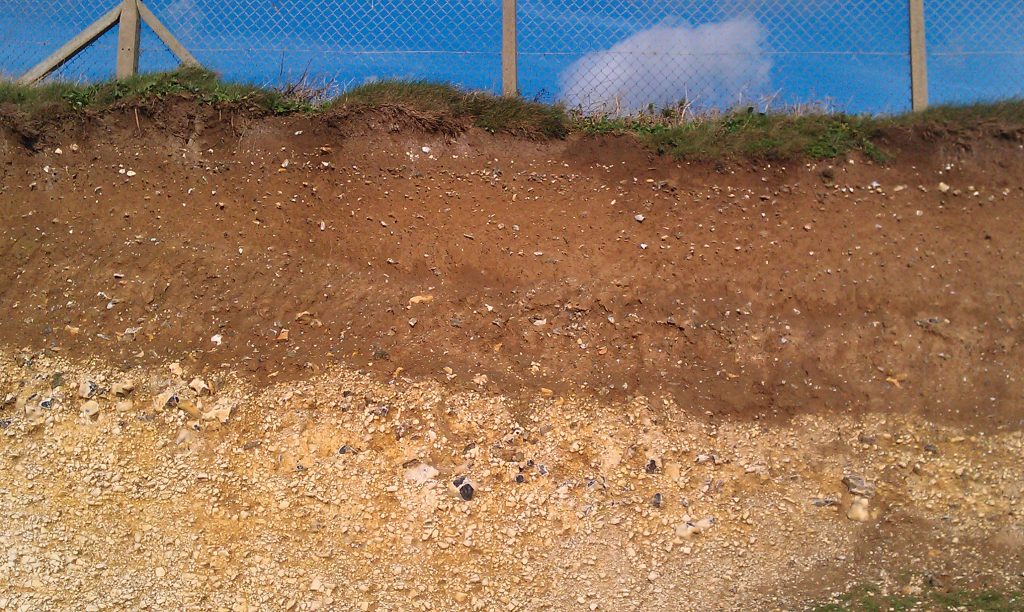
Past geologists have failed to identify these huge concave broken chalk sections of the cliffs accurately, or to date the river terraces deposited from the remains of the meltwater of the last glaciation maximum (LGM), as they have historically only identified the gravels and bedrock within geological periods. Their arguments are compounded as they fail to explain why they are relatively short distances from the sandy silt to today’s topsoil or why silt and sand are at elevations above supposed earlier river terracing, so they suggest these deposits are ‘windblown Loess’ – blown into position rather than deposits laid down by rivers of the past.
This book uses existing scientific evidence from peer-reviewed publications and modern mathematical models to give you an understanding of how the landscape looked in the Holocene period, giving archaeologists the tools to reveal fresh discoveries and a better understanding of our history.
The Last Ice Age
To understand how the last ice age affected the British landscape we need to look at the most up to date digital information we have available, which geologists of the past did not have access to for their published estimations/calculations on the size of previous ice age glaciation sheets and durations. These new mathematical models are based on accurate satellite measurements, sea marine archaeology and biology rather than just observational evidence.
The calculation used for the densities of ice and water
Calculating the sea level equivalent for a given volume of ice requires some simple maths and knowledge of the densities and properties of ice and seawater. Ice volumes are usually given in km3.
Gigatonnes
The mass of ice is usually given in metric gigatonnes (Gt). 1 Gt = 109 tonnes (where 1 tonne = 1000 kg); a gigatonne is 1 billion tonnes.
A tonne of water occupies one cubic metre (a cube 1m x 1 m x 1m). A gigatonne (Gt) occupies one cubic kilometre of water (1km x 1km x 1km).
Densities of ice and water (at one atmospheric pressure and 4.3°C)
• Density of glacier ice 916.7 kg/m3 or 0.9167 Gt/km3
• Density of pure water 1000 kg/m3 or 1.000 Gt/km3
• Density of seawater 1027 kg/m3 or 1.027 Gt/km3
We can calculate the mass of something if we know the volume and the density:
• Density = Mass / Volume
• Mass = Volume x Density
• Volume = Mass / Density
Because ice and water are different densities, 1 km3 results in different masses, however, remember that 1 Gt of ice = 1 Gt of water! They may take up different volumes but have the same mass.
So, 1 Gt (whether ice or water) is equal to:
• 1.091 km3 ice
• km3 pure water
• 0.9737 km3 seawater
Converting a volume (km3 ) to a mass of ice (Gt)
We can convert a given volume of ice (in km3) to a mass of ice (in Gt) by using the following equation:
• Mass of ice (Gt) = Volume of ice (km3) x Density of ice (Gt/km3)
If we have a calculated ice volume of 1.00 km3, then:
• Mass of ice = 1 x 0.9167 = 0.92 Gt of water
Correlation with Sea Level rises
Another way of calculating ice volume is to reverse engineer the changes in sea levels and the ice required to produce that increase. Calculating the sea-level equivalent from a mass of ice involves firstly, removing all ice below sea level. This ice is already displacing water and will not raise sea levels upon melting. Floating ice (ice shelves, sea ice, floating ice tongues) are already floating and displacing water, and so these ice masses do not raise sea levels upon melting.
Converting sea level rise to ice volume
To convert a mass of ice into the total amount global sea levels would rise if the ice all melted (i.e., the sea level equivalent), we need to know how much area the oceans cover.
This is usually stated as 3.618 x 10⁸ km2.
Therefore 1 mm increase in global sea level requires 10-3 m3 (10-12 km3) of water for each square metre of the ocean surface or 10-12 Gt of water.
We can calculate the volume of water required to raise global sea levels by 1 mm:
• Volume = area x height
• Area = 3.618 x 10⁸ km2
• Height = 10-6 km (1 mm)
Volume (km3) = (3.618 x 10⁸ km2) x (10-6 km) = 3.618 x 10² km3 = 361.8 km3 water. We can convert km3 of water to Gt of water; 1 km3 water = 1 Gt water – In the same way, 1 Gt of ice = 1 km3 water.
So, 361.8 Gt of water will raise global sea levels by 1 mm – and therefore: 361.8 Gt of water is equivalent to 394.67 km3 ice.
Using this calculation, other authors have attempted to estimate ice coverage at the end of the last glacial stage.
Table 1 – Size of the Last Ice Age (LGM)
| Author | Eurasia Ice Sheet (106 km3) | British Isle Coverage (106 km3) |
| Lambeck et al, 2006,2010,2017 | 18.25 | 7.2 |
| De Boer et al., 2014 | 33.5 | 13.22 |
| Argus et al.,2014 | 22.23 | 9.1 |
| Abe-Ouchi et al., 2015 | 16.6 | 6.56 |
| Peltier, 1994,1996 | 24.86 | 9.81 |
| Average | 23.09 | 9.18 |
We can estimate from this data an average of 9.18 (106 km3) of ice lay on the British Isle segment of the Eurasia ice sheet at the end of the last glacial stage (< 30,000 years ago) giving the average depth of ice in this area as 9.18 106 / landmass of 5.5 x 10⁶ (Hughes et al, 2015) or on average a glacier of 1.7 km in height.
From our previous calculations, we know that melted ice is:
• Mass of ice = 1 x 0.9167 = 0.92 Gt of water
Therefore, we have (9.18 x 106) x 0.92 = 8.42 quadrillion tonnes of water:
This is equivalent of 66,929 inches of rain falling on every square Inch of Britain’s landmass or the same as:
One Inch of rain steadily falling each and every day for the next 183 years
So how would that affect the landscape?
The worst known flooding in British history occurred in 1947 when just six inches of rain (149mm) fell on up to 12 inches of snow (so a maximum of 15″ of rain if melted) over a three-month period. According to the RMS Special Report1:
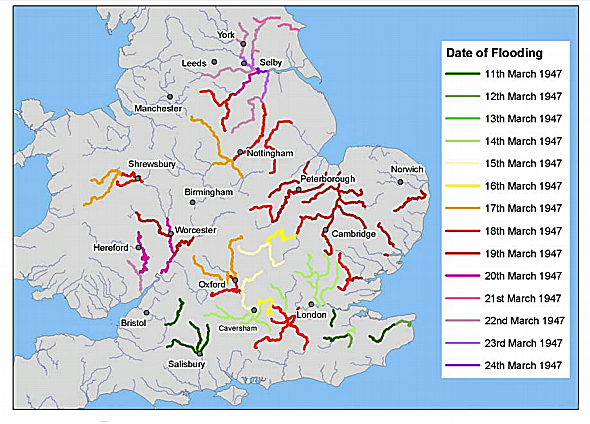
| Table 3 – 1947 Flooding of British Rivers with just 6 inches of water |
“In the second half of March 1947, the most catastrophic river floods for at least 200 years occurred in the United Kingdom. The flooding, which inundated nearly all the main rivers in the South, Midlands, and the Northeast of England, was notable for its origins, geographical extent, and duration.
Impacting on thirty out of the forty English counties over a two-week period, when around 700,000 acres of land became flooded. Tens of thousands of people were temporarily displaced from their homes, and thousands of acres of crops were lost.”
Flooding began across the South of England, from Somerset to Kent, as rivers such as the Avon in Somerset and Wiltshire, the Medway and Great Stour in Kent overflowed. Parts of west and northeast London were inundated on March 14 and 15 as the River Thames and other surrounding rivers also flooded.
Over 1,600 homes were overwhelmed at Caversham near Reading and flood levels peaked in the Lea Valley to the east of London on March 16. The swamping of the filter beds along the River Lea to the northeast of London meant that water supplies had to be cut off to more than a million people living in east and north-east London.
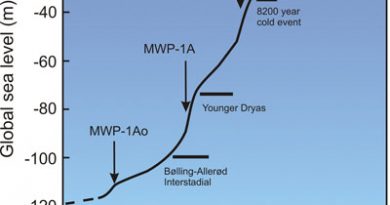
And this was caused by the equivalent of just 15 inches of rainfall – imagine the effect of 66,929 inches (4,460% more) of meltwater on the British landscape after the last Ice Age. The traditional view is that the majority of this glacier ice melted over a relatively short period creating ‘Meltwater pulses’ which raised sea levels as the climate warmed at the end of the ice age.
Several researchers have narrowed the period of this first pulse ‘A1’ to between 13,500 and 14,700 calendar years ago with its peak at about 13,800 before present (BP). This first ‘pulse would have lasted just 1,200 years, and the expectation is that the ‘meltwater’ would move from ice to surface water on and over the ground and then make its way through existing rivers to the sea.
But this simplistic model negates the long-lasting effect this flooding would have on the land soils, sands, gravels and bedrocks within the landscape and more importantly is hydrology.
For more information about British Prehistory and other articles/books, go to our BLOG WEBSITE for daily updates or our VIDEO CHANNEL for interactive media and documentaries. The TRILOGY of books that ‘changed history’ can be found with chapter extracts at DAWN OF THE LOST CIVILISATION, THE STONEHENGE ENIGMA and THE POST-GLACIAL FLOODING HYPOTHESIS. Other associated books are also available such as 13 THINGS THAT DON’T MAKE SENSE IN HISTORY and other ‘short’ budget priced books can be found on our AUTHOR SITE. For active discussion on the findings of the TRILOGY and recent LiDAR investigations that is published on our WEBSITE you can join our FACEBOOK GROUP.